
For anyone who wants to boost their e-commerce store sales, it’s incredibly useful to know all steps of user interaction with the website. However, without the right analytics tools, this may look like playing guessing games. For example, remember the “hot and cold” game where the chosen player has to figure out some mystery action and the crowd shouts “hot!” or “cold!” depending on the player’s right or wrong guesses?
No guessing games are needed if you are using a hot digital technique like heatmaps! With heatmap analysis, you always know for sure what your customers are doing on your website, and this information is visualized in the most convenient way.
Discover more about what heatmaps are, what data they provide, what insights you can get from heatmap analysis to improve your e-commerce conversions, and what heatmap analysis tools are out there.
Getting acquainted: what is a heatmap?
A heatmap, or a heat map, is a graphical representation of data where variations in values are displayed as variations in colors in a color scale, with different color hues and color intensity levels. Heatmaps provide an effective and accurate visual summary of data, with even large data sets communicated to the viewer almost instantly — a human eye detects color differences much faster than digits.
The term “heatmaps” was trademarked by software designer Cormac Kinney in the early 1990s. He created a tool to turn real-time financial market data into heatmaps so security traders can see better buying and selling opportunities. Today, heatmaps can be generated with different tools — from Excel spreadsheets to professional tools like the ones we are going to describe in this post.
What are website heatmaps and what do they show?
Although heatmaps can be used in various areas, website heatmaps are specifically meant to display the data about users’ behavior on web pages. Heatmap software collects data based on the patterns of users’ interactions, instantly processes it, and displays it in a color-coded form.
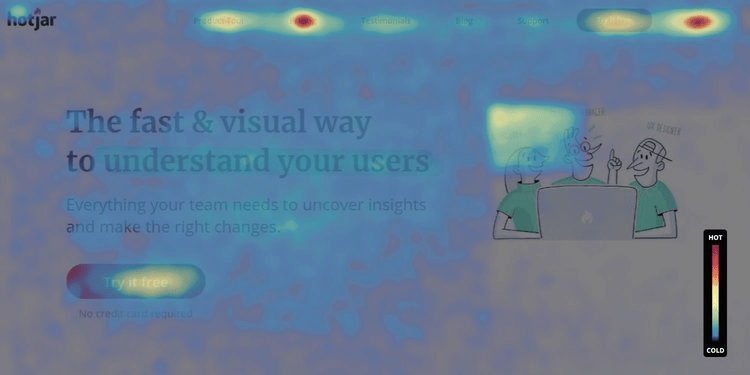
Depending on the intensity of the interactions, some page elements or areas are “hotter” and some are “colder.” This helps you understand your users’ real experiences “without drowning in numbers,'' as is very well said in the description of one of heatmap tools — Hotjar.
Here are the most common things that heat maps can show about your customers’ actions on your web pages:
- where they have clicked
- where they have moved their mouse
- how far down the page they have scrolled
Based on this, heatmaps can be classified into click maps, hover maps (mouse movement maps), and scroll maps. Classifications may differ in different sources. Still, scroll heat maps (also known as just “scroll maps”) have a clear distinctive feature — instead of areas of the intensity in interactions, they use tiers of colors to show what percentage of users scroll down to specific levels of the page.

What is heatmap analysis?
The process of reviewing the heatmaps to get valuable insights and make data-driven optimization decisions is known as heatmap analysis. Here are the 5 questions listed on the Hotjar tool’s official page that you need to ask during heatmap analysis:
- Do most people scroll as far as important elements are situated?
- Do they really click on the key elements that are supposed to click?
- Are there non-clickable elements that confuse them?
- Is there anything that distracts them?
- Are the experiences good on different devices?
- A glimpse at heatmap analysis for your e-commerce website
Heatmap analysis in e-commerce is especially vital as it gives you the whole picture of the sales funnel, including the stumbling blocks on your shoppers’ way that hinder conversions and make them leave. E-commerce store optimization based on heatmap analysis can help your shoppers find the right products and seamlessly complete their purchase, which significantly boosts user experiences, customer satisfaction and, of course, your sales.
The things to improve may be hiding in the layout, product placement, UX elements, content, navigation, pricing policy, website bugs, and much more. Here are some examples of what you can optimize based on heatmap analysis (and some of these improvements are obvious as best UX practices):
- locate CTAs, opt-ins, content sections, images, hyperlinks, and other important design elements in the right places where users are more likely to reach them
- simplify the steps of your checkout and sign-up forms
- make sure there are no hidden fees that only display at the checkout
- add a link to the support chat
- add the option to view the product images again in the shopping cart
- provide a high-quality zoom feature for product images
- add more payment options
- make your CTAs more convincing and your content more engaging
- remove duplicate CTAs, confusing navigation items, or other elements that puzzle users
- get rid of potentially useless elements that distract users
- fix links that won’t open or lead to wrong pages
- rethink your pricing policies
- and much more
Best heatmap analysis tools
There are plenty of heatmap analysis tools out there that offer various kinds of heatmaps, usually combined, as well as session recordings, A/B testing, or other associated features. Here are some of the most famous tools in this sphere.
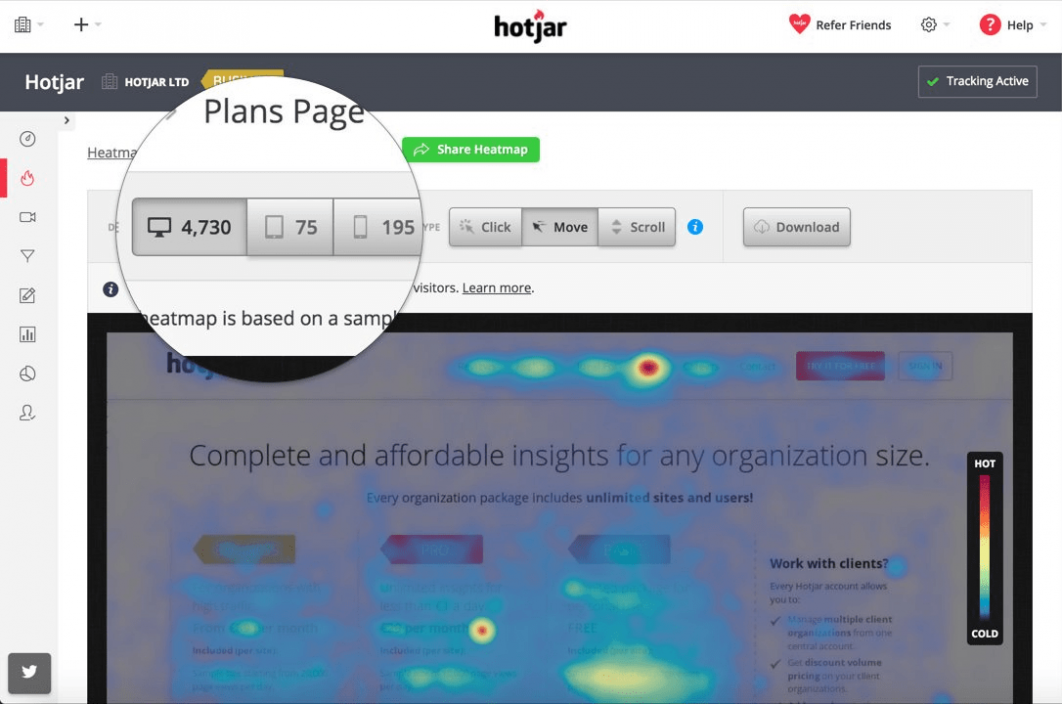
Hotjar
Hotjar can boast an impressive list of 900,000+ organizations across the globe that use the software. Hotjar is GDPR and CCPA compliant, so your customers’ privacy will not be impacted. It works with almost all platforms used for creating e-commerce stores such as Magento, Shopify, Drupal Commerce, WooCommerce, Wix, and so on. With Hotjar, you will see how your users click, scroll, and move through your website. You can also perform A/B tests, including ones to compare user behavior on different devices. Recordings of sessions (clicks, mouse movements, etc.) enable you to see what your users see. Incoming feedback and user survey tools complete your understanding of your shoppers’ preferences.
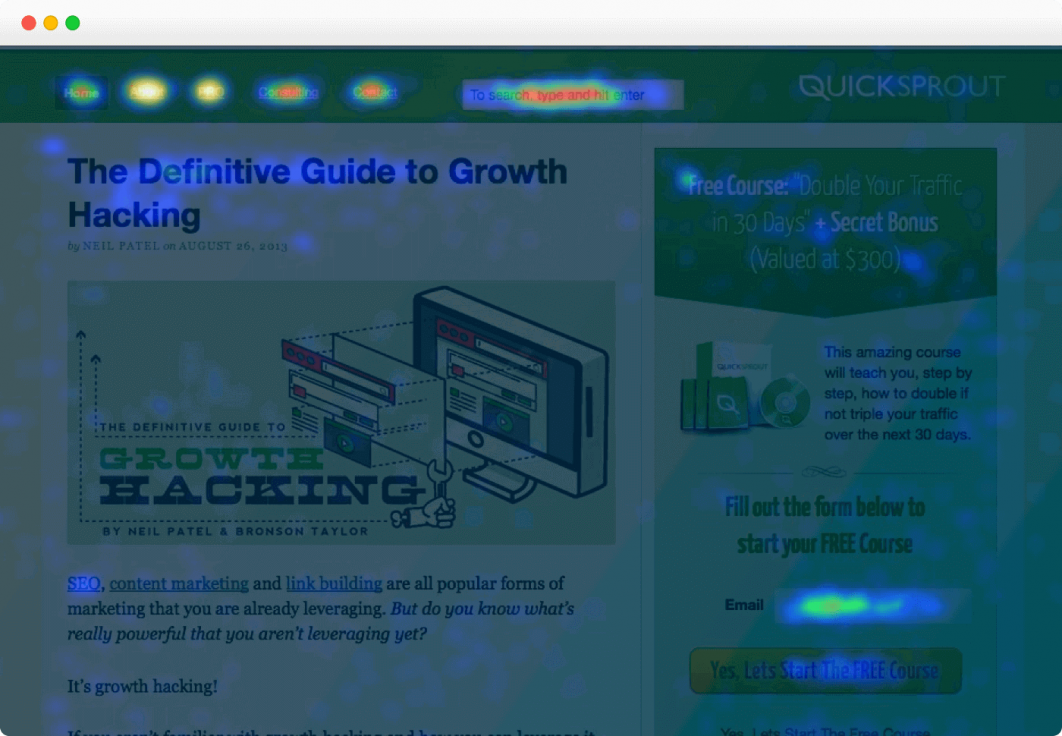
Crazy Egg
Crazy Egg is a traditional heatmap analysis tool invented by Neil Patel and Hiten Shah. It allows you to make sure your e-commerce store is optimized for purchases through viewing heatmaps, snapshots, and individual session recordings. You can create A/B tests for goals and conversions using the Crazy Egg A/B Testing Tool and the better versions will launch automatically. The Crazy Egg Editor allows you to quickly make changes. Crazy Egg easily integrates with e-commerce platforms like Shopify, Magento, and WordPress.
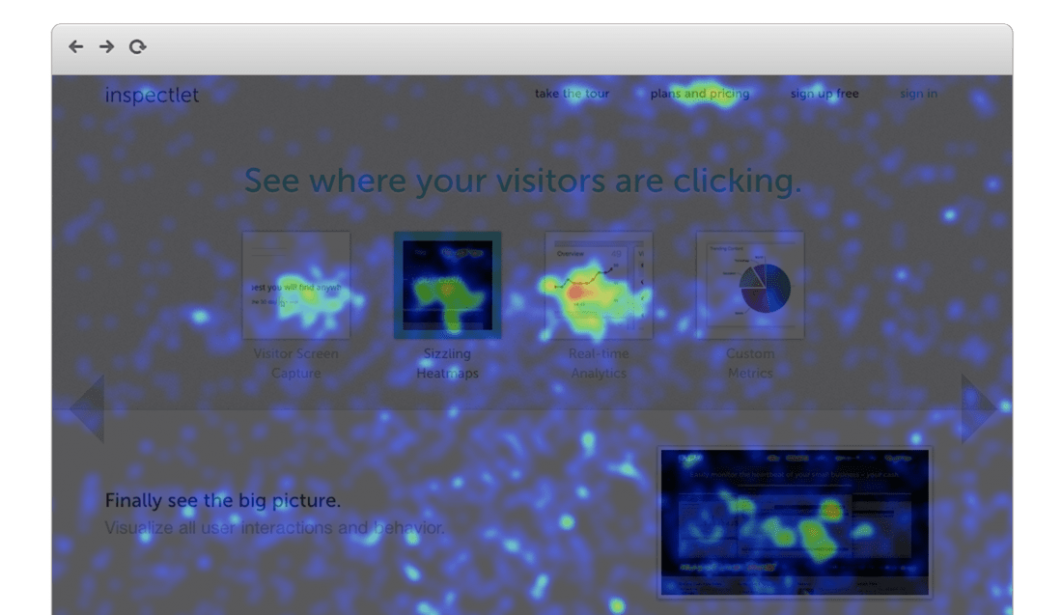
Inspectlet
The Inspectlet heatmap analysis tool visualizes the mouse movements your shoppers make in different parts of your web pages. Scroll heatmaps show how far down they scroll and how many actually reach the bottom of the pages. Session recordings enable you to see what your visitors do (move their mouse, click, scroll, press keys, etc.). Inspectlet has powerful filtering for the sets of data you are interested in. Conversion funnels show when shoppers drop off. The JavaScript tagging API lets you associate metadata with a user or a session. With A/B testing by Inspectlet, you can play with variations to find the one that performs best.
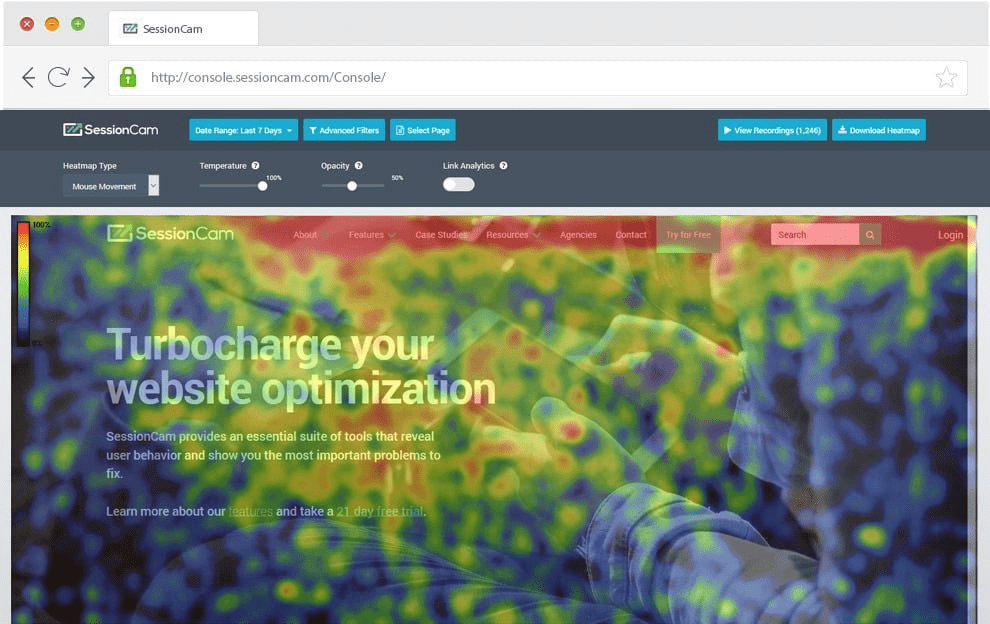
SessionCam
The next heatmap analysis tool on our list is SessionCam. It offers mouse movement heatmaps that aggregate all cursor movements your users make across your web pages. You can also compare different heatmaps on your website side-by-side to gain valuable insights. The comparison criteria can be anything — desktop vs mobile, completed purchases vs abandoned pages, and so on. Other features include session replays, conversion funnels, integration with Google Analytics, and more. SessionCam works perfectly on all kinds of websites, including responsive and dynamic websites, single-page applications, and so on.
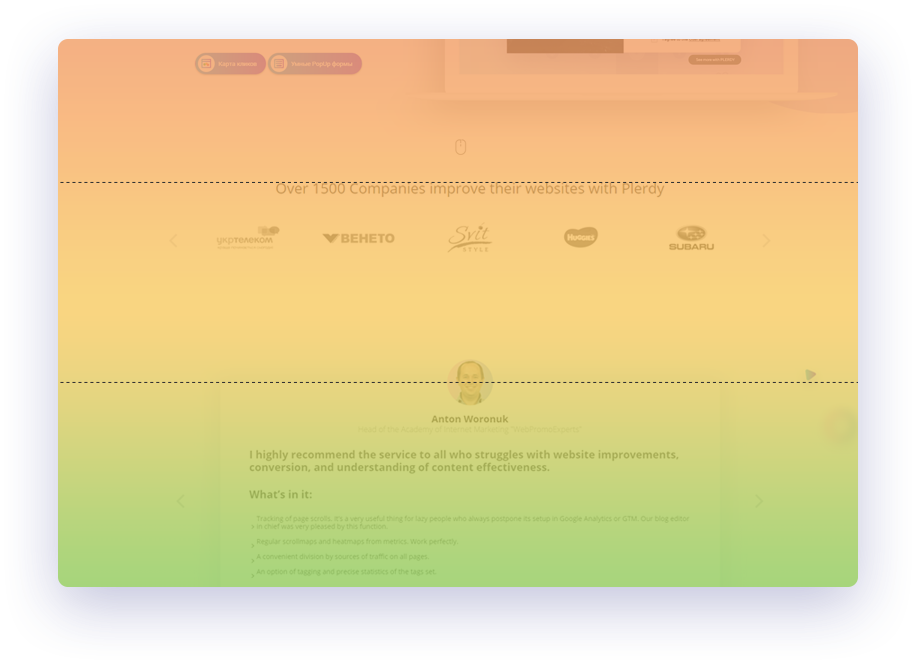
Plerdy
The Plerdy tool records all website clicks and displays them in real time, with the possible segmentation of users by traffic source. The hot segments will show you the areas with highest click-through rate. The click path analysis feature helps you determine the order of the clicks. Plerdy also offers a mouse hover map to see which areas have been hovered over most often. You can use event tracking to track clicks or hovers for selected elements only (for example, the “Buy” button in your e-commerce store). In addition, the tool has a scroll map for you to see how deep your pages have been scrolled. Plerdy also offers session replays and conversion funnels.
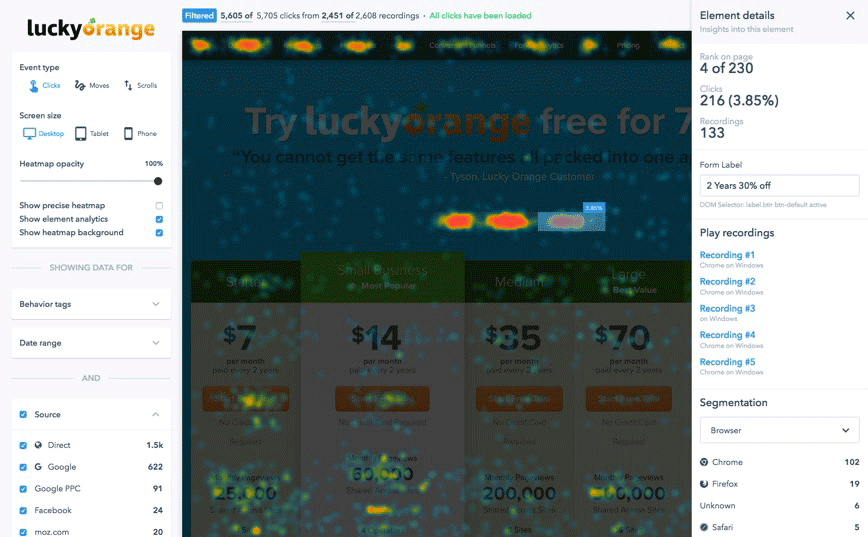
Lucky Orange
Lucky Orange creates interactive heatmaps that overlay as you browse your pages. You can see in real time how shoppers open links, click buttons, submit forms, and so on. Lucky Orange tracks clicks, moves, and scroll depth. The tool allows user segmentation based on multiple metrics (devices, browsers, dates, and so on) and you can compare the performance across all segments. It’s also possible to play recordings for more insights and make use of comprehensive analytics available for every element. You can use the Lucky Orange chat for communication with your customers through the checkout process, conversion funnels to identify where they drop off, polls to ask your customers’ opinion directly, and more.
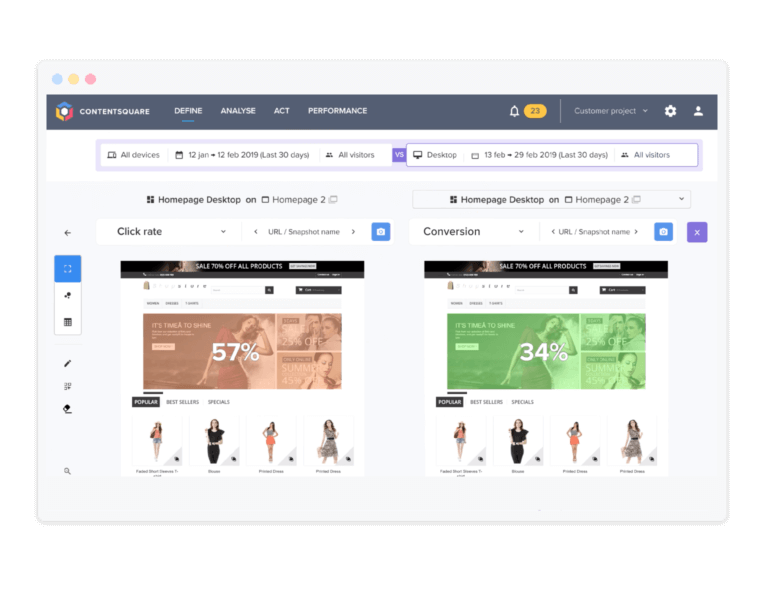
Contentsquare (Clicktale)
The Contentsquare tool, formerly known as Clicktale, is used by such brands as TMobile, Walmart, Clarks, The North Face, l’Occitane, Kenzo, Avon, and more. It provides intuitive zone-based heatmaps that show their shoppers’ in-page behaviors (click recurrence, hesitation, scroll depth, engagement, etc.) Advanced A/B testing with side-by-side comparisons of various versions is helpful for choosing the best version that brings the most outcome. Session replays reconstruct individual visitor sessions. The platform also offers comprehensive customer journey analysis features.
Final thoughts
It’s time to heat up your e-commerce sales with the help of one of the above mentioned or other heatmap analysis tools. Our development team can give you a consultation and optimize your e-commerce store based on the heatmap analysis insights, as well as on the best design practices. No “hot and cold games” — just the right optimization decisions!

Comments